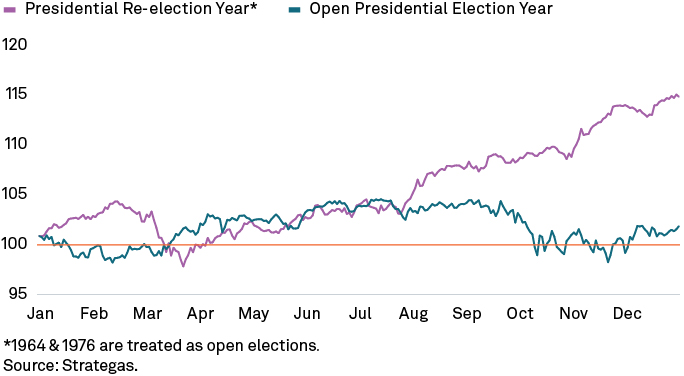
Whoever wins the presidential election, taxes are likely to rise in the years ahead. U.S. public finances are stretched, with debt exceeding 120% of GDP. Higher interest rates and Treasury yields have raised the government’s net interest cost as a percentage of tax revenue to 13.6%, the highest since 1997. Historically, such conditions have been associated with fiscal austerity as administrations realize they must either raise revenue by increasing taxes and/or reduce spending.
3. Update Your Plan
We know from our centuries of helping families to sustain their wealth that success over market cycles and generations goes beyond investing. As our retiring Chief Investment Officer, Leo Grohowski, shared in a recent podcast entitled, 4 Lessons from 4 Decades of Investing, it’s important to “Use all the tools in the toolkit,” including four other practices: manage, spend, borrow and protect. Based on our outlook for the year ahead, we believe that investors should evaluate actions across all of these areas including:
Execute on Three Investment Priorities
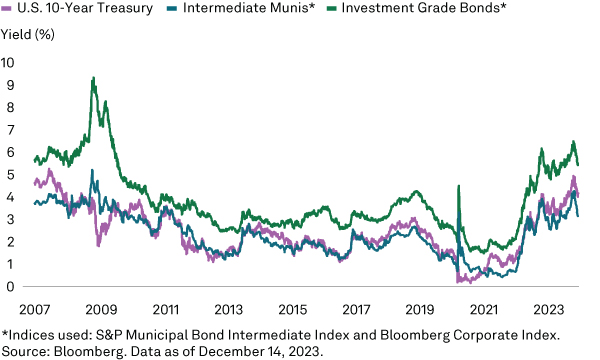
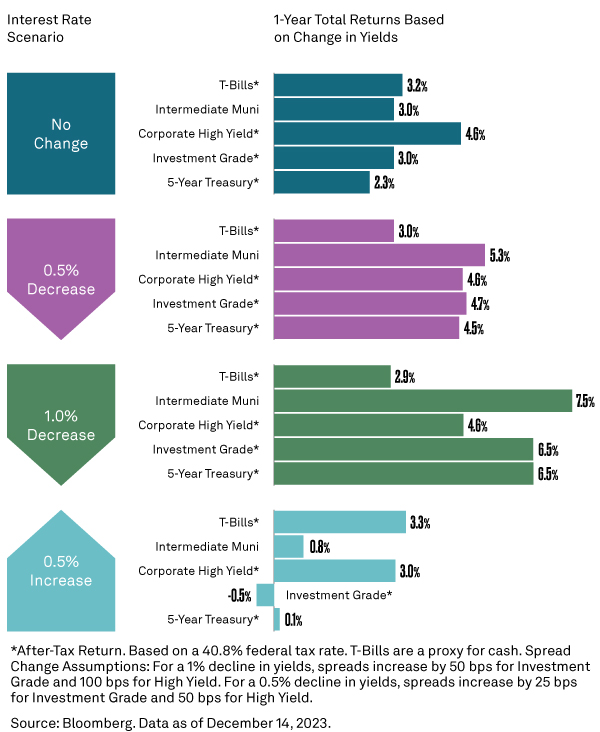
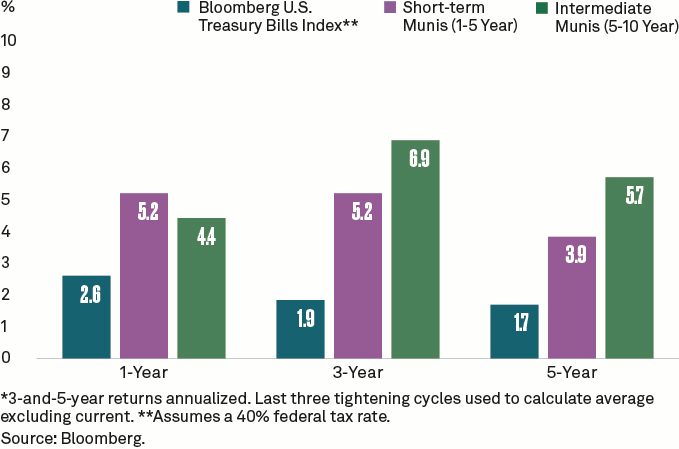
- Extend duration: Take advantage of a once-in-a-decade opportunity to modestly extend duration and lock in attractive yields across a variety of types of bonds.
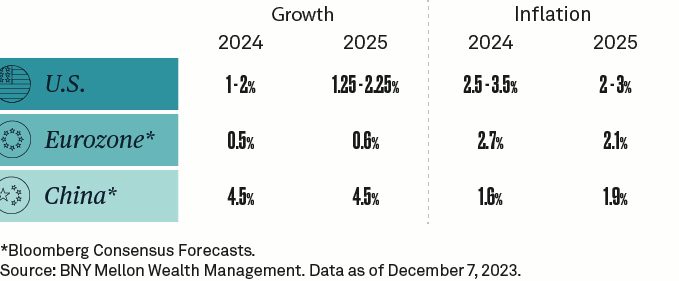
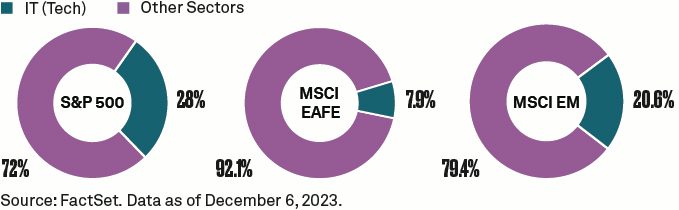
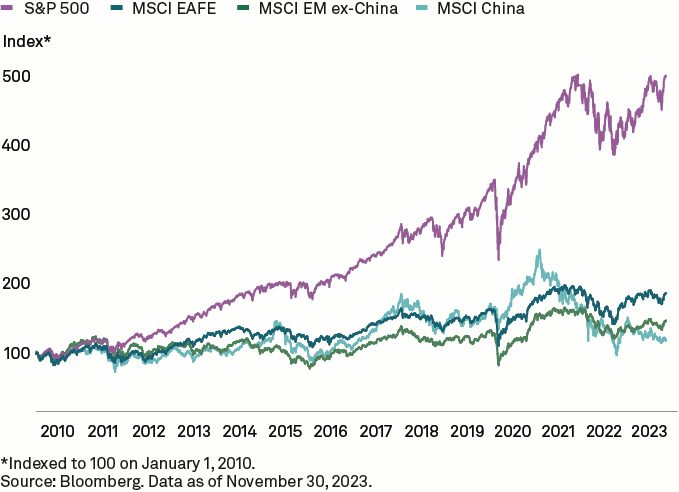
- Focus on U.S. equities’ potential: U.S. companies, relative to their non-U.S. peers, have better earnings growth prospects, better margins, and stand to benefit from the technological advancements associated with AI.
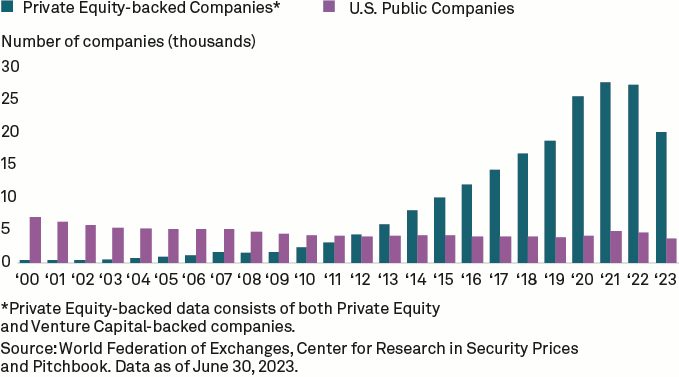
- Consider opportunities in private markets: Given the growth in private markets over the last couple of decades investors who can accept the illiquid nature of these investments can earn higher returns and diversified sources of income.
Manage for After-Tax Returns
Managing taxes is vital in all market environments. As inflation remains higher than in previous decades, after-tax returns become increasingly important for taxable investors. We have honed our expertise in delivering after-tax investment returns since 1997.
Plan Spending
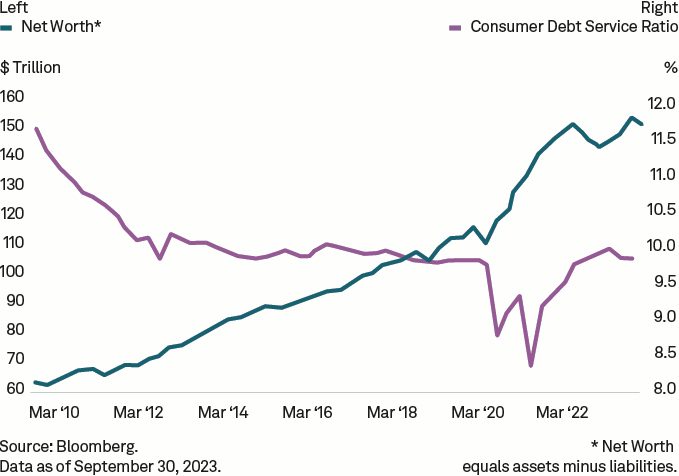
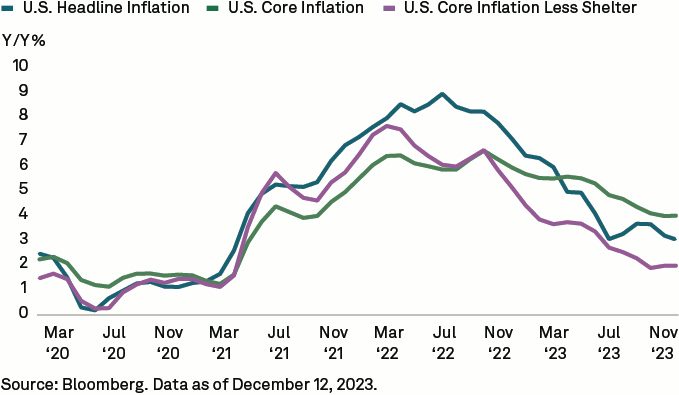
Inflation erodes purchasing power, and although we expect inflation to cool from here, it may settle at a higher level than a decade ago. It is important to review the impact of higher prices on your desired spending levels. For investors who have current spending needs such as retirees, trust beneficiaries and non-profits, having a spending strategy can help ensure that current expenses do not erode funds that will be needed for the future.
Evaluate Borrowing
Strategic borrowing can be a valuable tool for long-term investors. With short-term borrowing rates heading lower and bonds expected to earn equity-like returns for the first time in decades, it will be prudent to evaluate your strategic use – and source of – credit. While interest rates have fallen, the availability of credit has also fallen across the bank sector, as many banks address idiosyncratic balance sheet issues. BNY Mellon has a strong and resilient balance sheet to support our clients through the business cycle.
Leave a Legacy
The goal of creating sustainable, multigenerational wealth is to leave behind a legacy that supports what matters most, such as family, values and charitable causes. Make sure that you’ve utilized your lifetime exemption before the current level of $12.92 million per individual or $25.84 million per couple expires at the end of 2025.
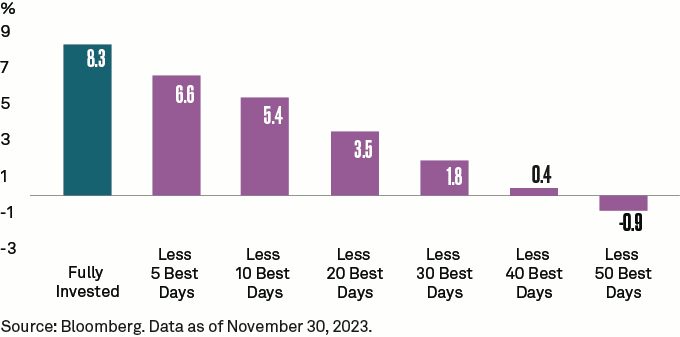
It is easier to forecast the path of markets over many years than it is for a single year. Time is an investor’s greatest ally, as markets rise over longer periods. Investors who stay invested should be rewarded over time.
Appendix
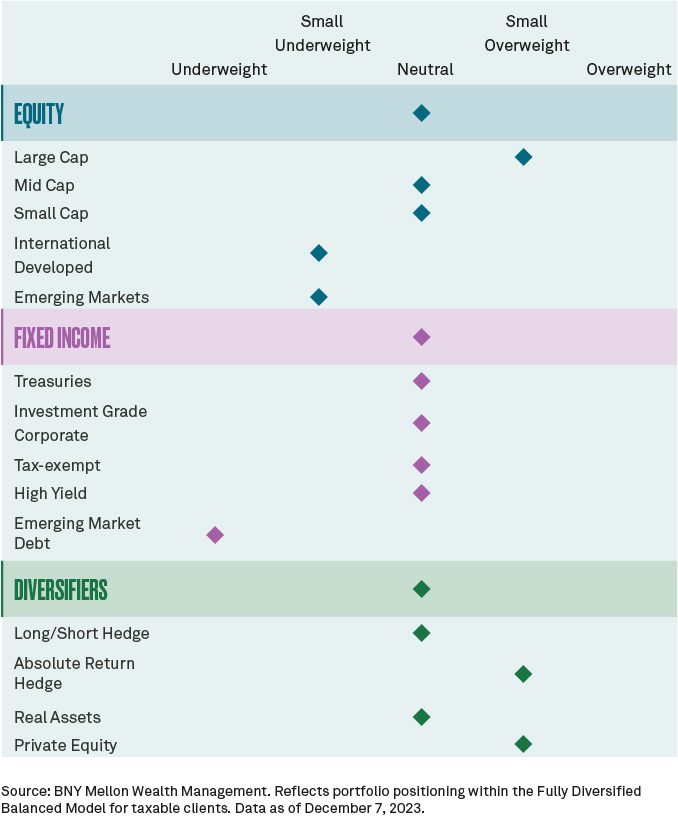
FIGURE 15
Asset Class Positioning
Investment Strategy Committee Recommendations